 LA 'BRT' and LRT
[Photos: L. Henry, Transit Coalition]
Related Links
Light Rail Now! can be contacted at: Light Rail Now! |
Busting "BRT" Mythology Comparative Success and Potential in Attracting Ridership With this article, Light Rail Now initiates a new series we're calling Busting "BRT" Mythology – a discussion intended to examine claims of so-called "Bus Rapid Transit" by its proponents and to evaluate and contrast these claims with actual experience. This is the first article in this series. In recent years, "Bus Rapid Transit" ("BRT") has emerged as the highway and motor vehicle industry's competitor of choice to rail transit (and especially light rail transit, or LRT) new-start proposals. While "BRT" is a curiously fuzzy concept, subject to widely divergent interpretation, depending on the specific proponent (see our article "Bus Rapid Transit" or "Quality Bus"? Reality Check [1]), it has gained ground in new transit systems planning, not only because of vigorous marketing from the road lobby, but also because of its heavy official promotion by the Federal Transit Administration. According to many promoters of "BRT", buses (with enough amenities and service improvements) can provide "all the benefits of rail, but cheaper". As we've noted in our article A Bus by Any Other Name is Still ... a Train? [2], the FTA's "BRT" marketing website has urged planners to "Think Rail, Use Buses" – a slogan presented by the FTA as "the quickest way to describe Bus Rapid Transit". According to the FTA, "BRT combines the quality of rail transit and the flexibility of buses." [3] Rail and bus equally attractive? Central to the effort to promote "BRT" is the contention that there is no basic difference in attractiveness to passengers between "BRT" buses and rail transit. The Bay Area Transportation and Land Use Coalition, for example, in a manifesto titled Revolutionizing Bay Area Transit ... on a Budget – Creating a State-of-the-Art Rapid Bus Network (October 2002) [4] asserts that "BRT" can offer "The speed and comfort of rail – on a bus budget." The report goes on to argue that "As researchers have found, the public has no preference for trains or buses if the quality of service is the same." Some researchers make similar claims. Moshe Ben-Akiva of MIT and Takayuki Morikawa of Japan's Nagoya University, in a paper titled "Comparing ridership attraction of rail and bus" (Transport Policy, Volume 9, Number 2, April 2002) [5], assert that
The assumption of "mode equality" in terms of attractiveness to pasengers is inherent in most ridership forecasting models – and insisted upon by FTA. Because of inherent weaknesses in many models, and other factors – particularly, simplistic or mechanistic assumptions about human behavior – some models even predict higher "BRT" ridership for basically similar types of service in the same travel corridor. Ostensible evidence: rail outperforms bus But something seems wrong with this picture – the experience of actual transit operations doesn't seem to jibe with the predictions and the claims. By and large, despite the barrage of "Think Rail, Use Buses" hype, the evidence overwhelmingly suggests that rail, such as the increasingly preferred LRT mode, significantly outperforms "BRT" in attracting ridership. Unfortunately, so far, no clear evidence has seemed to emerge that definitively identifies whatever specific, quantifiable factors may exist that attract passengers more strongly to rail rather than bus transit service (where travel time and out-of-pocket cost are roughly equal). In the absence of comprehensive research evidence, the FTA has been reluctant to permit transit planners to incorporate any such factors (often termed "rail bias") in the transit ridership forecasting process. It should be noted that, in some cases, and under certain special circumstances, a few specific, individual transit agencies operating both rail and bus have been allowed to tweak their planning models to reflect the stronger passenger-attractiveness of rail if they could demonstrate a difference in their own operations. However, forecasting procedures for Alternatives Analysis studies for totally new major transit investments (New Starts) are prohibited from doing so. Thus, widely used forecasting models tend to ignore bona fide modal differences and function with indifference toward the modes being compared, evaluating only service levels and cost in producing ridership estimates. Certainly, some Quality Bus (or "BRT") services – and even regular, local services in some high-volume corridors – attract substantial ridership. Even before initiation of the MetroRapid "BRT", for example, Los Angeles's Wilshire transit bus corridor routinely experienced daily flows of more than 50,000 rider-trips per weekday. However, while the reasons are not entirely clear, there is abundant evidence that, for equivalent routes and services, rail transit typically tends to attract significantly higher ridership than does bus service – including Quality Bus or "BRT". In a study titled "impact on Transit Patronage of Cessation or inauguration of Rail Service", for example, published by the Transportation Research Board in 1989 (Transportation Research Record 1221) [6], Edson L. Tennyson, PE, concludes that, when service conditions are equal,
In a subsequent analysis of recent LRT and busway installations, Tennyson concludes that, for new starts installed in corridors serving the core areas of American cities, "BRT" busways have attracted only one-third of the rider-trips estimated for them by modeling approved by the Federal Transit Administration (FTA). In contrast, new LRT operations have attracted 122 percent of their projected ridership. [2] (See "BRT" - You Can Build it ... But Will They Come? [7]) Survey evidence of public's rail preference Further corroboration of such research – and evidence of widespread public preference for rail public transport – are provided by the results of occasional public surveys. For example, as our article American Public Says: Let's Have More Rail! reports, when asked which modes they would like to see "have an increasing share of passenger transportation", 44% of respondents to a recent Harris poll selected "commuter" trains (apparently referring to both local and regional rail transit). That was nearly double the 23% that opted for "Local bus service". In another example, a 2001 United Kingdom survey, as summarized in Tramways & Urban Transit of June 2001, revealed that "motorists put light rail top of the list of preferred transport alternatives...." (See Motorists prefer light rail over buses, reports UK poll) The research results, contained in a UK government-sponsored document, Transport Choices of Car Users in Rural and Urban Areas, were based on a survey of households located in the Manchester, Bedford, Hull, and north Suffolk areas. "Of the public transport options appraised in the survey, light rail was regarded as an acceptable and convenient alternative to the car and generally considered to be frequent, quick, clean and safe" explained the survey report. In contrast to the light rail results, according to the T&UT summary, "buses were perceived as falling substantially short of meeting people's needs", and buses "were seen as undesirable and low status...." Such statistical conclusions and survey results are reflected in the fact that, on most new LRT systems, parking lots are jammed, and riders are pouring onto trains; while, in contrast, typical new "BRT" systems may experience modest increases in ridership, but certainly not the avalanche of passengers seen on LRT. Reality lessons from actual operating results There is a plethora of real-world evidence underpinning the research data. Unfortunately, it's mostly "anecdotal" – because conducting controlled scientific experiments of two different transit modes offering the same basic service in the same corridor is virtually impossible. But consistently repeated examples of transit mode performance can suggest patterns helpful in planning analysis and decisionmaking. The following examples provide some case studies of both rail transit and busway-type "BRT" operations which tend to suggest that, with similar service levels in the same or similar corridors, such "BRT" services have not attracted the same level of ridership as rail operations. These cases, and the evidence cited above, suggest that the potential of LRT and other rail alternatives to attract ridership in corridors specifically targeted for major transit investments may be greater than planners assume and than somewhat mechanistic forecasting models (constrained by strict Federal Transit Administration guidelines) predict. · Suburban Philadelphia, 1967 – The conversion of the Ardmore electric rail trolley (legacy LRT) line to a busway resulted in an almost immediate 15 percent loss of ridership; furthermore, an increase in operations and maintenance (O&M) costs (due to the need for more buses to maintain schedules, despite sinking ridership) provoked a downward spiral in service and ridership to a point where the line today carries only a few hundred daily rider-trips. [7] · Northern Virginia suburbs of Washington, DC, 1970-1996 – The Shirley Busway was deemed a great success upon its opening in 1970. The pre-existing Route 18 was expanded from three trips per day (without subsidy) to approximately thirty trips with subsidy – yielding a substantial increase in ridership. However, with long gaps between buses, political pressure grew to convert the busway into an HOV lane, opening it up for use by automobiles and other private motor vehicles. Ridership peaked in 1980-81 during the second energy crisis. Subsequently it declined 67% as costs increased sharply. At the same time, transit ridership in the National Capital area ballooned from 135 million per year to 270 million, mainly because of the introduction of the MetroRail system. In 1996, ridership on the Route 18 Shirley Busway buses had plunged to 2,350 weekday rider-trips. As MetroRail service was introduced to the Route 18 territory (Springfield, Virginia), bus ridership dropped further to 1,650 per day; however, MetroRail patronage in Springfield soared to 13,000, even though bus fares were lower than rail and travel time was approximately equal. Furthermore, the operating cost of rail transit was far less per passenger. [7] · South Pittsburgh, 1978 – The South Busway, projected to carry 35,000 weekday rider-trips, actually attracted only 20,000 rider-trips initially, and that level has now dropped to about 14,500, less than pre-busway ridership in the affected corridor. Meanwhile, a parallel LRT upgrade has attracted approximately fifty percent more passengers. [7] · East Pittsburgh, 1983 - The East Busway was originally projected to attract 80,000 weekday rider-trips, but the actual service initially attracted only about 30,000. The system actually lost 25 percent of bus riders as the busways were further developed. [7] · Pittsburgh, 1999-2000 – The West Busway, with a capital cost of approximately $55 million per mile, was originally projected to attract 50,000 weekday rider-trips. However, initial ridership of only 5,400 has grown modestly to about 9,500 (19% of original projections); in part, this may be temporary, as repairs to a parallel bridge in the corridor initially delayed motor vehicle traffic and have given a temporary ostensible advantage to the busway. [7, 8] Taken as a whole, Pittsburgh's three busways were forecast to attract a total of approximately 165,000 weekday rider-trips. In reality, only 55,000 daily rider-trips have actually materialized some 25 years from the opening of the region's first busway. [7, 8] in recent years, transit development seems to have shifted more heavily into expansion of Pittsburgh's LRT system. · Los Angeles, 1997-2000 – The Harbor Transitway, with busway stations, cost approximately $500 million for ten miles of route. A project of the Los Angeles County Metropolitan Transportation Authority (LACMTA), the busway was originally projected to attract 63,000 weekday rider-trips, in actuality, the service has attracted only about 5,000.
What is particularly striking about the Harbor Transitway "BRT" service, however, is that it approximately parallels LACMTA's Blue Line LRT service, several miles to the east, and in a roughly comparable corridor. Yet the Blue Line has exhibited far superior ridership attraction. By 1995 – roughly the same length of time that the Harbor Transitway has been in operation – ridership had reached 40,000 per day ... about 8 times the ridership level of the Harbor Transitway "BRT" service. And that's with peak-period headways (i.e., passenger waiting times) on the Blue Line LRT that are 6.5 minutes compared to the 4-minute headways on the Harbor Transitway "BRT" – i.e., over 50% higher! Even allowing for the difference in route length (the Blue Line, at 22 miles, is about twice as long), LRT has still outperformed the Harbor Transitway "BRT" in ridership by a factor of four. Today the Blue Line's ridership has exceeded 80,000 per day. In terms of cost-effectiveness, the Harbor Transitway "BRT" has been distinctly unsuccessful. The Los Angeles County Metropolitan Transportation Authority and political leaders have endeavored to bolster ridership by reducing the "BRT" fare by half and adding service, but to date there has been no clear improvement. [7, 9, LRN analysis]
· Los Angeles, 2003-2006 – Two recent public transit facilities of nearly the same length – the Gold Line LRT (a 13.7-mile line opened in July 2003, serving the Pasadena area northeast of central LA) and the Orange Line "BRT" service (a 14-mile busway, opened in October 2005, operating predominantly on a dedicated busway through the San Fernando Valley) – seem to invite comparison. However, it must be emphasized that the two lines serve corridors with dramatically different characteristics. The Orange Line busway operates in a much more mature transit corridor with a population within 0.5-mile of the line 42% greater than that along the Gold Line. In addition, the Orange Line serves at least 40% more major activity centers than does the Gold Line. [9, 10; population analysis by Darrell Clarke; other analysis by LRN] It should be noted that, because of electric propulsion, better level crossing protection, and other factors, the Gold Line LRT provides an 18% faster schedule speed than the Orange Line "BRT". However, this advantage would appear to be matched in Orange Line service by the significantly lower peak-period headways (i.e., less waiting time for passengers) on the Orange Line busway: approximately 5 minutes average on the "BRT" vs. 11-13 minutes on the Gold Line LRT. [10] Taking these factors into consideration, one would expect the Orange Line to be carrying approximately 59% higher ridership than the Gold Line at a comparable point from opening: January 2004 for the Gold Line vs. April 2006 for the Orange Line. At that point, the Gold Line's ridership was 15,400, and the Orange Line's was 18,700. However, to match the passenger-attracting performance of the Gold Line, with its denser and more transit-favorable corridor features factored in, the Orange Line busway should have been carrying about 24,500 rider-trips by April 2006. In other words, the Orange Line busway's ridership is approximately 24% lower than one would expect from a comparable LRT service in the same corridor. [10, LRN analysis]
Certainly, there is no question that the Orange Line "BRT" is a major transit improvement in the corridor it serves (and, given applicable legal restrictions constraining LACMTA, a busway was effectively the agency's only option for implementing a high-quality, rapid public transport service in the available former railway alignment). However, it also seems clear that, with comparable conditions, far from exceeding LRT in performance, this is another case where "BRT" has failed to match the success of LRT in attracting ridership. · Denver, 2000-2001 – in an article describing how Denver's then-new southwesterly LRT extension to the exurb of Littleton was overwhelmed with passengers, Denver Business Journal reporter Cathy Proctor assured readers that "Packed light-rail cars, overflowing parking lots and passengers left behind on station platforms aren't unique to the Regional Transportation District's new Southwest light-rail line." On the contrary, "They are scenes repeated around the country as people flock to new rail transit lines in numbers far beyond initial projections." [11] As Proctor's report related, RTD's new Southwest rail line – after only a few months – was carrying up to 14,000 rider-trips on weekdays, some 66 percent above the original projections of 8,400. As a result, parking was difficult to find at certain stations along the line, and complaints were mounting about trains crammed with passengers and cars haphazardly parked on private property adjacent to the stations.
According to the reporter, Denver's case reflected similar situations on new LRT lines around the USA: "Like Denver, transit agencies in Dallas, Salt Lake City and St. Louis all have endured problems associated with the openings of new, wildly popular rail lines that are drawing people who never considered taking the bus." Proctor cited several examples: · Salt Lake City – The region's relatively new 15-mile light-rail line, opened in December 1999, was by 2001 already carrying an average of 20,000 people on weekdays – 43 percent above projections, according to a transit agency spokesman. · Dallas – The metro area's new LRT line experienced ridership that exceeded projections by 30 percent. · St. Louis – The region's 7-year-old Metrolink LRT system was attracting ridership 14 percent over projections for the year 2000, according to an agency spokesman. While Denver's RTD blamed outdated population projections for part of the problem, RTD and representatives of several other transit agencies criticized bus-transit-based, FTA-mandated modeling procedures for underpredicting rail ridership. As our analysis Light Rail's Besieged With Riders! This is a Problem? [12] explains, "Ridership-forecasting modelling procedures mandated by the Federal Transit Administration unrealistically expect public behavior to be the same whether they're offered LRT or just a bus." in the words of Doug Allen, then vice president of planning and development for Dallas Area Rapid Transit, "The federal government wants us to use these models to compare various projects, like light rail and bus lines, the same way." However, our own analysis also cites the assessment of transit agency officials that "The problem is that people like light rail a lot more than they like buses – a fact the federal rules don't take into account ...." According to Mick Crandall, program director for Utah's Wasatch Front Regional Council, "How people respond to rail is different than how they respond to bus." "There's a dependability on travel time with rail that there isn't with buses" Crandall added. "It has its own tracks and you know where it goes." According to Proctor's story, RTD's survey of riders on the Southwest line found nearly 60 percent of those who hadn't used RTD's bus system were now, a few months after opening pf the new line, taking LRT at least three times a week. In Dallas, ridership on a new rail line was three times greater than ridership on an express bus that used the same route. Some of the factors which may underpin these public behavioral results are discussed in a study performed in suburban Philadelphia in 1991 under the auspices of the Delaware Valley Citizens Council for Clean Air. (See Research Study: Riders Prefer Light Rail to "Bus Rapid Transit" [13]) As the survey report indicates, the routes selected for the survey, all operated by the Southeastern Pennsylvania Transportation Authority (SEPTA), were the Media and Sharon Hill LRT (trolley) lines and the Route 103 bus to Ardmore, a Quality Bus ("BRT") type of service which relies particularly on private busway alignments in Ardmore and near SEPTA's 69th St. Terminal. According to the report, "These routes were selected for the project because of the relative homogeneity of their demographic areas and similarity of their types of service, features which present a rarely experienced opportunity to focus on mode-specific behavior and perceptions." The following are some conclusions of the survey which may be relevant to the role of ridership forecasting as planners in various urban areas evaluate rail and bus modal alternatives for major new-start transit investments. · LRT tends to attract a greater proportion of nonwork trips than [busway] bus for these generally equivalent types of transit service. · Nonmotorized access times to and from LRT stations/stops are significantly greater than those for [busway] bus for these similar types of service. This finding, which is consistent with results of some other studies, suggests that LRT patrons tend to be willing to walk (and possibly to bike) further to and from LRT services than is the case for [busway] bus, in this instance by a difference of nearly 3 minutes. · This finding also suggests that modifications to ridership forecasting models may be warranted to incorporate assumptions of approximately one-third greater walking-access distances/times for LRT than for [busway] bus. · LRT appears to project a more positive image to its passengers than in the case of similar bus service. LRT passengers evidently find LRT routes more understandable, schedule adherence more reliable, and LRT vehicles more spacious and more comfortable overall, producing less odors, fumes, and noise. Ridership forecasting – needs Reality Check? Despite the barrage of real-world evidence, currently deployed ridership forecasting assumptions and models continue to render what seems like wildly unrealistic, over-optimistic ridership projections for "BRT" bus schemes in contrast to LRT projections, which are often under-estimated. In addition to weaknesses in the modelling process previously noted, above, other factors may be involved. For example, commonly deployed forecasting models may overstate the impact of differences in relatively short transit headways. This may tend to to "penalize" rail alternatives (by lowering ridership estimates), since rail service assumptions typically include reducing vehicle frequencies by running multiple railcars in trains – thus increasing headways modestly. In contrast, bus alternatives tend to be "rewarded" with higher ridership estimates, since designers attempt to provide similar capacity to rail via assuming greater numbers of individual buses running at shorter headways, . However, at peak headways appreciably less than 15 minutes, it would seem unlikely that major differences in passenger attraction to a given system would be produced merely by differences of a few minutes in waiting times. Another serious weakness of most commonly utilized forecasting models is the failure to account for "bus bunching" – i.e., the tendency of buses in real- world operation (as a result of traffic, passenger loading fluctuations, and other factors) to depart from established, regular, short headways and instead bunch into "platoons", providing de facto service at much wider headways. The net result is to render "trains" (platoons) of buses at longer headways approximately the same as those of rail – thus nullifying the supposed "advantage" of shorter headway/wait time assumed in the hypothetical modeling process. The Bottom Line: The planning process, and particularly the analysis of LRT vs. "BRT" alternatives, needs a stronger dose of real-world experience, and less speculation and rigid reliance on rather mechanistic modelling. The performance records of numerous examples of LRT and "BRT" systems in actual operation should speak for themselves. it's certainly difficult to ignore or dismiss what to most reasonable people would seem to be a rather distinctive superiority of rail transit services in attracting the public away from motor vehicles and into public transport.
Rerferences cited 1. Light Rail Progress editors. "Bus Rapid Transit" or "Quality Bus"? Reality Check, Light Rail Now website, Updated 2004/01/22: http://www.lightrailnow.org/facts/fa_brt007.htm 2. Light Rail Progress Production Team. A Bus by Any Other Name is Still ... a Train? Light Rail Now website, Updated 2006/01/15: http://www.lightrailnow.org/features/f_brt008.htm 3. Federal Transit Administration (FTA). Bus Rapid Transit website (2001): http://www.fta.dot.gov/assistance/technology/research_4234.html 4. Bay Area Transportation and Land Use Coalition. Revolutionizing Bay Area Transit ... on a Budget – Creating a State-of-the-Art Rapid Bus Network, October 2002. 5. Moshe Ben-Akiva and Takayuki Morikawa. "Comparing ridership attraction of rail and bus", Transport Policy, Volume 9, Number 2, April 2002. 6. Edson L. Tennyson, PE. "impact on Transit Patronage of Cessation or inauguration of Rail Service", Transportation Research Record #1221, Transportation Research Board,1989 [6]: http://www.heritagetrolley.org/articleTennyson.htm 7. Light Rail Progress editors. "BRT" - You Can Build it ... But Will They Come? Light Rail Now website, Updated 2005/11/10: http://www.lightrailnow.org/facts/fa_brt001.htm 8. Light Rail Now Production Team. Photo-Report – Pittsburgh West Busway, Light Rail Now website, Updated 2005/08/04: http://www.lightrailnow.org/news/n_pit-bus-westbway-photoessay_2005-01.htm 9. US Census Bureau, United States Census, 2000. 10. Los Angeles County Metropolitan Transportation Authority (LACMTA) website (2006): http://www.metro.net 11. Cathy Proctor. "RTD not alone in ridership problems", Denver Business Journal, 26 January 2001. 12. Light Rail Progress staff. "Light Rail's Besieged With Riders! This is a Problem?" Light Rail Now website, March 2001: http://www.lightrailnow.org/news/n_den002.htm 13. DVCCCA Survey staff. Survey of SEPTA Light Rail/Bus Rider Behavior & Perceptions: Preliminary Report of Onboard Survey Secondary Results, Delaware Valley Citizens Council for Clean Air (DVCCCA), September 1991: http://www.lightrailnow.org/facts/fa_00012.htm Light Rail Now! website URL: http://www.lightrailnow.org/facts/fa_brt_2006-08a.htm Updated 2006/08/27 | |||
|
|
||||
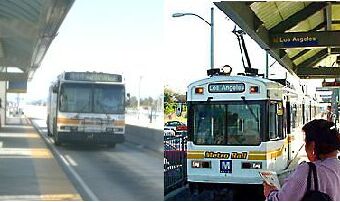
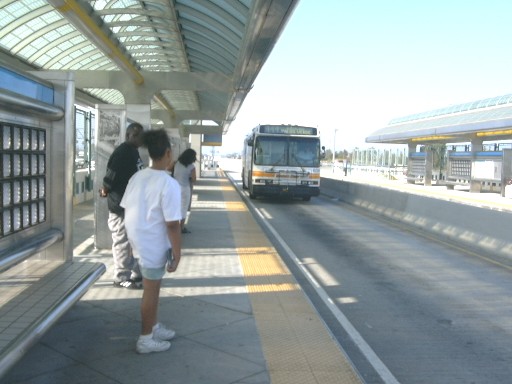 LA's Harbor Transitway "BRT" service parallels Blue Line LRT in similar corridor, providing fast bus service with much shorter peak-period headways.
Ridership averages around 5,000 a day.
LA's Harbor Transitway "BRT" service parallels Blue Line LRT in similar corridor, providing fast bus service with much shorter peak-period headways.
Ridership averages around 5,000 a day.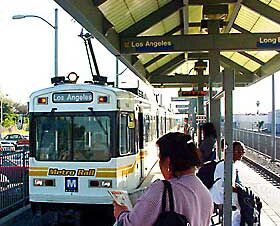 For comparable length and level of service, LA's Blue Line LRT attracts more than four times the ridership of the parallel Harbor Transitway "BRT".
Ridership now exceeds 80,000 a day.
For comparable length and level of service, LA's Blue Line LRT attracts more than four times the ridership of the parallel Harbor Transitway "BRT".
Ridership now exceeds 80,000 a day.

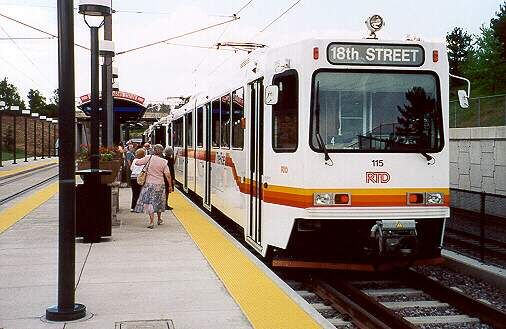 Ridership on Denver's new-start LRT system has exceeded projections
substantially, leading planners to question bus-based ridership modeling assumptions.
Ridership on Denver's new-start LRT system has exceeded projections
substantially, leading planners to question bus-based ridership modeling assumptions.
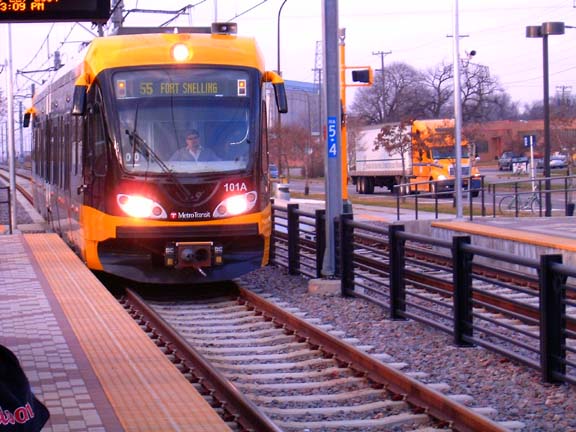 With over 31,000 daily rider-trips, Minneapolis's Hiawatha LRT line has exceeded ridership forecasts 15 years early.