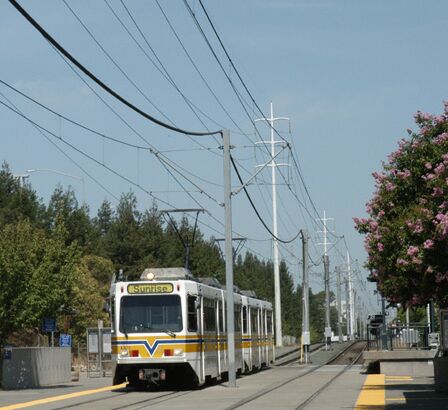
 Sacramento light rail transit and high-voltage power line [Photo: Peter Ehrlich]
The Light Rail Now Project can be contacted at: Light Rail Now! |
Electrification 101 How Many BTUs on the Head of a Pin? ...er...Power Line? NOTE: This is the fifth article in our series Electrification 101 – a discussion aimed at informing transportation professionals, decisionmakers, and the public at large of the value and advantages of electrifying transportation operations, and the electrification of public transport systems in particular. For many decades, it's been widely accepted within the fields of transportation, energy, and urban planning that electrified public transportation – and pre-eminently, electric rail mass transit – provides an exceptionally clean, energy-efficient form of mobility. Thus, in an era when the global supply of petroleum appears to be peaking ("Peak Oil") and the concern is growing over the threat posed by Global Warming and the effects of carbon (CO2) emissions, attention is increasingly turning to electrified public transport as an effective tool for helping address these critical problems. Transitioning from internal-combustion modes, such as motor buses, to electric public transport as part of the solution would seem to be a no-brainer. But partisans of petroleum-fueled motor vehicles (especially, private automobiles and motor buses) have lately launched a campaign to disparage the energy-efficiency of electric transit – focusing particularly on claiming that electric rail modes supposedly consume, on average, more energy per passenger-mile. Battle of the BTUs In the USA, the dispute over energy centers around the BTU, or British Thermal Unit, a commonly used measure of heat-energy that enables a comparison between diverse forms of energy production and consumption, such as coal, natural gas, petroleum, nuclear, etc. (The equivalent metric unit of energy measure is the joule.) in what might be called the "Battle of the BTUs", opponents of electrified public transportation have seized on a new figure for assessing the energy content of electric power recently publicized by the US Department of Energy's Oak Ridge National Laboratory (DOE/ORNL). Traditionally, an energy conversion value generally ranging between 3,412 to 3,415 BTUs per kilowatt-hour (kw-hr) has been commonly accepted worldwide for converting electric power into equivalent BTUs, and thus facilitating equitable comparisons of electrical energy consumption by electrically powered transportation modes with transport modes powered by motor fuel (including natural gas). This conversion factor has proven useful and widely accepted because it assesses energy content at the point of use and thus enables a fair comparison of electric-powered modes with the energy content of, say, a gallon of diesel fuel, a cubic foot of natural gas, or other power sources for transportation also measured at the point of use.
However, perhaps responding to recently heightened interest in tallying total
carbon emissions, some DOE/ORNL researchers have publicized a revised
conversion figure that supposedly assesses total energy of electric power
"generation and distribution" – i.e., back at the power plant, the point of
production and distribution, rather than the point of use (consumption by the electric transit system).
This factor is promulgated in the ORNL's Transportation Energy Data Book, of which the latest (2007) version is Edition 26.
This document can be accessed online at the following URL: http://cta.ornl.gov/data/index.shtml In Table B.6, "Energy Unit Conversions", the energy value of 1 kw-hr is given as 3,412 BTU. However, in a footnote the Data Book states,
Now, in an ordinary, placid, purely scientific context, whether electric power should be counted as 3,412 BTU or 10,339 BTU might be of little interest beyond the scientific community and perhaps those who deal with measuring gross energy consumption and effects such as carbon emissions. But in the context of the ongoing Transit War in North America, it's no ordinary issue, since motor vehicle proponents, on a crusade to discredit electric rail public transport, have embraced the three-times-higher BTU figure and are proceeding to brandish it as a weapon in basically invalid comparisons with automobiles and buses (for which they calculate energy usage based on the end-user energy content). Certainly to no-one's surprise, rail transit critics are presenting calculations highly favorable to petroleum-fueled modes, particularly private motor vehicles and motor buses. To many outside or on the periphery of these issues, this might tend to sound like an argument similar to the classic (Middle Ages) theological dispute over "How many angels can gather on the head of a pin?" in this case – how many BTUs on the end of a power line?
But this is more than just an arcane issue disputed among a handful of hairsplitters – it ultimately impacts issues of national and even international energy and transport policy. Indeed, it's possible that elements representing or promoting the petroleum industry (who have already launched a national media blitz across the USA extolling "clean" diesel fuel and its contribution to "blue skies") are trying to distort this issue in a way to make it appear that electrical power for transport is extremely inefficient and motor fuel transport is relatively very efficient – all with a goal to winning the "PR" war in the context of growing public concern over Peak Oil and Global Warming. Needed: Equitable comparison
One cannot take the diesel fuel in the fuel tank, ignore all the energy it took to get it there, and then compare that energy content with the energy way back at a power plant, hydroelectric dam, or wherever. Undoubtedly, that need for equivalency is probably why the rest of the world prefers end-user energy usage as the basis of comparison, and accepts the 3,412-3,415 conversion values. Nevertheless, if we assume it is useful to calculate the relative energy efficiency of electric vs. motor fuel transportation modes with generation and distribution energy investments included, can we derive a reasonably equitable comparison? Electric power: Alternate efficiency assessments In regard to the generation/distribution efficiency of electric power, as Leroy Demery has pointed out, the efficiency may be greater than the 33% assumed by the US Department of Energy. For example, the thermal efficiency of "combined cycle" power generation is much greater (48 percent) than that of "simple cycle" generation (about 33 percent). This information is based on the following source: Martinez, Bobby, Cyrus B. Heher-Homji, John Paschal and Anthony Eaton, "All Electric Motor Drives for LNG Plants" (2005). See URL: http://lnglicensing.conocophillips.com/NR/rdonlyres/B78B6727-E5F4-4505-B9C3-96CC94D7B30D/7358/GastechElectricMotorPaper.pdf In a 2006 study, Martin Eberhard and Marc Tarpenning calculate an electric power generation/distribution efficiency of more than 52% based on a combination of factors:
Source: Martin Eberhard and Marc Tarpenning, Tesla Motors Inc., The 21st
Century Electric Car, 6 October 2006.
See URL:
The generation/distribution-to-end-user efficiency of electric power (in this case)
is therefore: Citing different professional reference sources, San Francisco engineer Norman Rolfe likewise argues that the generation efficiency of modern fossil fuel power plants is significantly higher than the US DOE assumes – in Rolfe's analysis, ranging from 40 to 45%. Rolfe cites as his source Marks' Standard Handbook for Mechanical Engineers, 9th Edition, 1987, Table 9.4.4, page 9-56. "That's why I use the figure of 45%" states Rolfe. "Efficiencies have probably increased since 1987." Furthermore, he points out,
Based on these considerations, our analysis concludes that it is reasonable to assume a slightly higher efficiency (35%) than that estimated by the Data Book researchers – reflecting the USA's gradual introduction of more efficient power generation processes in recent years. End-user energy pricing analysis Now, how can an equivalent "production/distribution" efficiency be assessed for motor fuel provided to end-users? One way of approaching this is to proceed from the standpoint of the energy market and the pricing mechanism. Light Rail Now Project researchers wondered: Does it not stand to reason that the relative price of net energy for either electric power of motor fuel would reflect all the inefficiencies involved in production and distribution? Therefore, could this not be a way to compare the relative production/distribution losses for either source of consumer energy? Thus, Light Rail Now Project researchers undertook to assess the relative costs per BTU for each mode's energy use per the analysis described below. Electric power base cost The most recently reported cost of electric power for transportation is: 9.63 cents per kw-hr
Source: Motor Fuel base cost The most recent national average cost per gallon of gasoline motor fuel is $2.84.
Source: The most recent national average cost per gallon of diesel motor fuel is $2.90.
Source: Energy conversion, electric power vs. gasoline
Automotive gasoline = 125,000 BTU/gallon
Source: [NOTE: 3,415 BTU/kw-hr is the factor for end-user electric power conversion used in this analysis] Results of analysis
Cost per 1,000 BTU provided to end-user Thus, per BTU provided at the ultimate point of consumption, electric power seems to be 30% more costly than gasoline, and about 33% more costly than diesel fuel. On the assumption that (a) labor costs and productivity between the two forms of end-user energy product are roughly the same, and (b) the cost or "investment" inputs that determine ultimate cost to the user mainly reflect the raw energy consumption and other, similar, activities and investments needed to create the energy in BTUs available to the ultimate user, pricing could be taken as a means of assessing relative energy production and distribution efficiency. On the basis of the end-user cost differential, and if pricing is to be taken as a yardstick of efficiency, the calculation so far suggests that the relative efficiency of the energy, delivered (distributed) from the production point (i.e., power generating plants for electricity, refineries for motor fuels) only differs by about 30-33%. In other words, the 30% to 33% higher cost per BTU of electric power could be interpreted to represent the extra "wastage" of energy, or lowered efficiency, that occurs in the process of power generation and distribution. However, at least some of the relatively higher price per BTU of electrical energy delivered to the end-user may alternatively reflect, to some extent, a "premium" based on the greater value of electric power because of its greater flexibility as a power source. In other words, while motor fuels can power highway motor vehicles and railroad locomotives, plus a few other machines such as lawn mowers, portable generators, etc., electricity is far more versatile (capable of powering everything from lighting to kitchen appliances to air conditioners to elevators to industrial machine tools to computers to water purification systems to pipeline pumps, and so on and on) – and thus electric power can command a higher, or premium, market price. The higher cost per BTU might reflect this premium. Therefore, the "differential" between the end-user price of motor fuel vs. electric power as a measure of relative efficiency may actually be much smaller than the nominal price differential would suggest. This in turn suggests that the relative production/distribution efficiency of motor fuel is fairly close to that of electric power. Motor fuels: Production/distribution efficiency The pricing analysis summarized above may be useful in suggesting some approximate guidelines of relative production/distribution efficiency, from the standpoint of the end-user, between electric power and motor fuels. However, in an attempt to identify more precisely the comparative production/distribution efficiency of motor fuels, a more detailed assessment of factors is useful. Thus, the following analysis provides a somewhat rough and rather conservative effort at calculating these energy losses (i.e., "wastage") in the production/distribution of motor fuel. For appropriate comparison with electric power resources, the analysis focuses on the additional energy involved in the production of motor fuels from the refinery (i.e., beyond the level of bunker oil, commonly used in power generation) through the distribution system, including fueling stations, to the tank of the motor vehicle. As Leroy Demery has noted, several studies demonstrate significant losses in motor fuel production and distribution, including from the refinery through the fueling station. For example, Eberhard and Terpenning state that:
Source: Allowing for some losses in operation of fueling stations (including service stations), we could round this down to 80% efficiency – i.e., energy losses tallied at 20% using this "inventory" method. Eberhard and Tarpenning's key reference for their 81.7% figure appears to be the following (cited as reference 3 in their paper): Well-to-Tank Energy Use and Greenhouse Gas Emissions of Transportation Fuels – North American Analysis, June 2001, by General Motors Corporation, Argonne National Laboratory, BP, ExxonMobil, and Shell. Vol. 3, Page 59. Based on the foregoing analyses, it is plausible to assume that electrical energy constitutes a significant proportion of the total energy input in the refining process, and also in the operation of pipelines and other fuel distribution facilities. However, in tallying the total electrical energy consumed in the refining, transportation, fueling, and other components of the motor fuel production and distribution process, US Department of Energy analyses may not fully account for the total energy inputs of generation and distribution. For example, a related DOE document – Energy Bandwidth for Petroleum Refining Processes, prepared by Energetics incorporated for the U.S. Department of Energy Office of Energy Efficiency and Renewable Energy industrial Technologies Program (October 2006) – states the following:
The GREET (Greenhouse Gases, Regulated Emissions, and Energy Use in Transportation) model, developed mainly by Argonne National Laboratory and the US Department of Energy, is useful, but appears to attempt to assess the complete life-cycle energy investment in various types of motor vehicles, including the process of manufacturing and eventual disposal – whereas our own analysis focuses more simply on the energy investment in the production of motor fuels from refinery to vehicle tank. It is also not clear whether the GREET model (or other similar models assessing the production/distribution energy involved in motor fuels) has used an energy-efficiency basis of 80% or otherwise in converting the energy expenditure for motor trucking of motor fuel to BTUs. A graphic representation of the GREET model is available online at the following URL: http://www.transportation.anl.gov/software/GREET/index.html From this and the other information cited, it is plausible to assume that the GM et al. motor fuel production/distribution energy assessment cited above (which is related to the GREET model) significantly underestimates the total energy expenditure involved in the production and distribution of motor fuel. On this basis – and the energy differential indicated by the pricing analysis previously described – it is plausible to subtract an additional conservative adjustment of 5 to 20 percent from the 80% efficiency figure referenced above, to account for such additional energy losses in the refinery production and ultimate distribution process. To remain conservative, this analysis calculates a final efficiency figure of 75% in the production/distribution of motor fuel. Actual motor fuel production/distribution efficiency may well be less than this, since the differential in implied efficiency is still greater than that implied by the pricing analysis approach (i.e., comparative cost to end-user per BTU provided, which suggests near-parity in efficiency between electric power and motor fuel provided to the end-user).
Nevertheless, the current analysis concludes that the assumption of 75% efficiency is probably acceptable as a very conservative value for production and distribution of motor fuel energy to the fuel tanks of end-user vehicles. (NOTE: For natural gas motor fuels, where the refining component is minimal, production/distribution efficiency of 85% is assumed.) Urban transport energy efficiency In regard to the energy of motor fuel vs. electric power propulsion, one must keep in mind that, in addition to production and distribution efficiency, there also comes into play the direct efficiency of the given transport mode, involving internal combustion engines and rubber tires vs. electric motors and steel wheels – and, in this respect, electric rail modes tend to excel. Rail transit's steel wheels tend to eliminate the energy wastage inherent in the "flattening" of rubber tires as they bear weight, and highly efficient electric traction motors avoid the relative wastage inherent in internal combustion engines. These technological factors, plus the higher load factors characteristic of rail transit, tend to produce significantly higher overall performance efficiency for rail. So, when all these efficiency calculations and associated factors are pulled together, how do various major urban transportation modes stack up in comparative energy efficiency? To assess efficiency, we'll calculate energy intensity with a measure of BTU per passenger-mile. The ORNL's Transportation Energy Data Book, Edition 26, presents a figure of 3,496 BTU/passenger-mile However, this figure has two problems. First, it is based on a mix of both urban and intercity travel and vehicle occupancies, yielding a multi-use average of 1.57. But why compare urban transit travel with intercity automobile (including SUVs, etc.) travel? The occupancy rate for urban automobile travel is approximately 1.2 – thus, about 24% lower than the average figure given in the Data Book. Correcting for this, we get an urban energy-intensity of about 4,320 for urban automobile (personal motor vehicles, including sedans, SUVs, etc.). However, we now encounter the second problem – that is, the ORNL's average energy intensity figure is based only on end-user energy (i.e., the energy content simply of the motor fuel in each vehicle's tank). Correcting again for production/distribution energy, we can use the 75% efficiency figure derived above. This yields a figure of about 5,760 BTU/p-m (passenger-mile) – substantially higher than the average typically presented for urban/intercity travel and based merely on fuel-tank energy.
The table and graph below provide a comparison on the basis of fully assessed energy consumption, including production, distribution, and end-use, for each mode. Clearly, these major public transit modes provide substantially improved energy efficiency than private motor vehicles – as gauged by energy intensity (lower = better) – with definite potential for significantly reducing US dependency on petroleum.
Urban Transportation Energy intensity – Major Modes
LRT Light rail transit (BTUs per Passenger-Mile)
But what about carbon emissions? Whereas 100% of the energy used by all petroleum and gas-powered transportation modes emits CO2, only about 70% of US electric power is derived from CO2-emitting sources. The table and graph below – again, on the basis of fully assessed energy, including production, distribution, and end-use, for each mode – compare energy intensity with respect to carbon-emitting energy sources. Obviously, electric rail transit and electric trolleybus modes provide substantially better carbon-based energy efficiency than motor vehicles, either motor bus or private car, and thus represent a very promising tool in the effort to reduce carbon emissions and thus to mitigate Global Warming.
Urban Transportation Carbon-Emitting Energy intensity – Major Modes
LRT Light rail transit (BTUs per Passenger-Mile)
Hopefully, the foregoing analysis will inject some much-needed factual information into the energy debate and America's ongoing, relentless "Transit War", and help to move this discussion somewhat closer to the realm of reality. Light Rail Now! website | ||||||||||||||||||||||||||||||
|
|
|||||||||||||||||||||||||||||||
 US Department of Energy's GREET model may not fully account for all the energy losses in use of electrical energy in refining and both
electrical power and motor fuel consumption in distribution of motor fuels.
US Department of Energy's GREET model may not fully account for all the energy losses in use of electrical energy in refining and both
electrical power and motor fuel consumption in distribution of motor fuels.
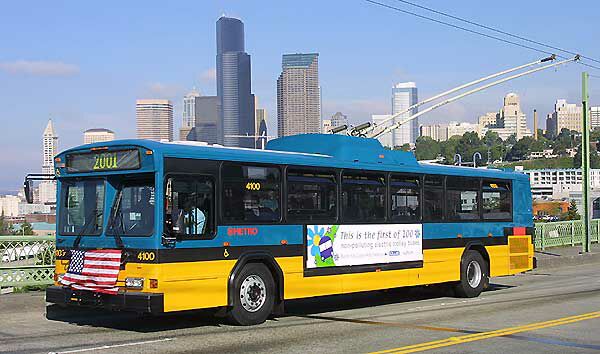 For comparison, this analysis assesses several major urban transit modes:
motor bus (diesel and natural gas), light rail (LRT, electric), rail rapid transit
(RRT, electric), regional passenger rail (RPR, "commuter rail", electric and diesel), and trolley bus (electric – see photo at right).
Average performance data for 2005 were taken from the American Public
Transportation Association, Public Transportation Fact Book, 58th Edition, May 2007.
For comparison, this analysis assesses several major urban transit modes:
motor bus (diesel and natural gas), light rail (LRT, electric), rail rapid transit
(RRT, electric), regional passenger rail (RPR, "commuter rail", electric and diesel), and trolley bus (electric – see photo at right).
Average performance data for 2005 were taken from the American Public
Transportation Association, Public Transportation Fact Book, 58th Edition, May 2007.