 Graph of injury + fatality rates [Graph: Light Rail Now Project]
The Light Rail Now Project can be contacted at: Light Rail Now! |
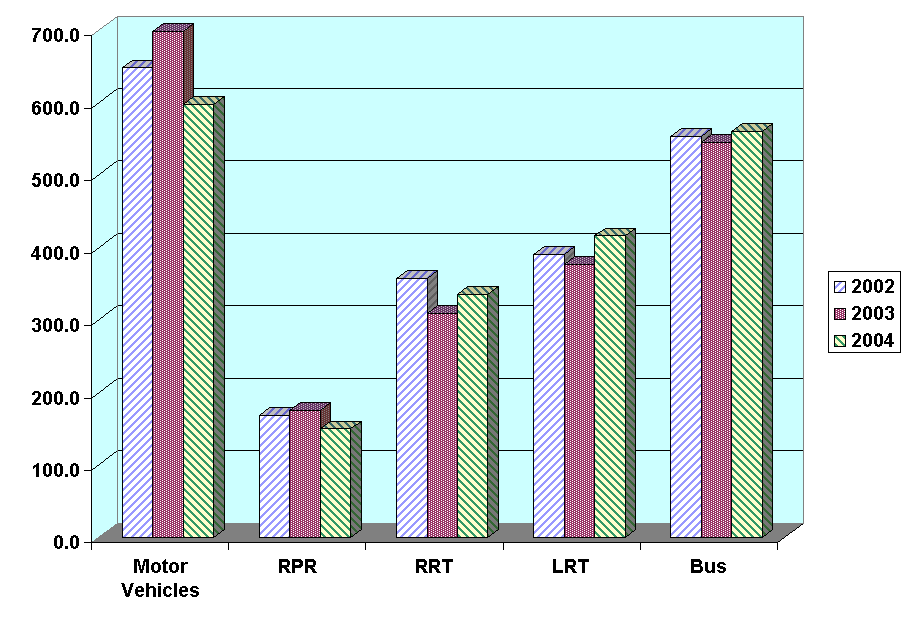
NOTE: Injury + fatality data in this article were originally mislabeled as "Injuries and Fatalities per Passenger-Mile". In reality, the data present Injuries + Fatalities per Billion Passenger-Miles, and the labeling and titles have been corrected to reflect this. Recent US data continue to confirm that public transit – particularly light rail and other forms of rail transit – is an extremely safe way to travel compared with private motor vehicles on streets, freeways, and highways ... and certainly, by far the safest way to travel in urban areas. Thus it is astounding that some roadway zealots and spokesmen for highway industry interests claim that, despite more than 40,000 officially recorded street and highway deaths annually in the USA, transportation in private motor vehicles is somehow "safer" than by mass transit. in reality, as available data readily demonstrate, urban public transportation continues to be far safer than private motor vehicle travel, operating in what is increasingly a "traffic battleground" of urban streets, freeways, tollways, and parking facilities. To attain an adequate and comprehensive perspective on safety in urban public transportation, one must examine both injuries and fatalities. As Light Rail Now has previously noted, while the number of fatalities is relatively small, the number of injuries is many times higher, and assessing the combination of both is important to achieving an adequate perspective on relative safety. Unfortunately for researchers trying to demonstrate this with reliable statistical data, comparing general fatality and injury rates among private motor vehicle travel and public transport is difficult because the standards for reporting and tabulating such accidents are not consistent – standards for public transit tend to be significantly more comprehensive. For example, passenger accidents in transit stations are tallied as transit-related accidents, while accidents in parking lots, driveways, and other motor vehicle facilities are not tallied as "highway" accidents. Likewise, while accidents in transit maintenance facilities are tallied, motor vehicle-related accidents in service stations, repair shops, and home garages are not. Nevertheless, even with these limitations and disparities, fatality and injury rates – based on data covering recent years from the National Safety Council, the US Department of Transportation, and the American Public Transportation Association – reaffirm statistically the substantial safety advantages of public transit, and especially rail. The Light Rail Now Project team examined data and calculated and compared combined fatality and injury rates for the most prominent modes of mechanized transportation in US urban areas: motor vehicles (automobiles, SUVs, pickup trucks, etc.), regional passenger rail ("commuter rail"), rail rapid transit (metros, subway-elevated, or "heavy rail"), light rail transit, and motor buses. The results are presented in the table and graphs below. US Injuries + Fatalities per Billion Passenger-Miles(2002-2004)
LRT Light rail transit Sources:
National Safety Council, Report on injuries in America,
Selected Measures of Unintentional injuries, U.S., 2001-2005
US Federal Transit Administration, Transit Safety and Security Statistics
and Analysis, Annual Report (Formerly SAMiS), injuries by Mode and Year
US Federal Transit Administration, Transit Safety and Security Statistics
and Analysis, Annual Report (Formerly SAMiS), Fatalities by Mode and Year American Public Transportation Association, Public Transportation Fact Book, 58th Edition, May 2007 (2002-2004)
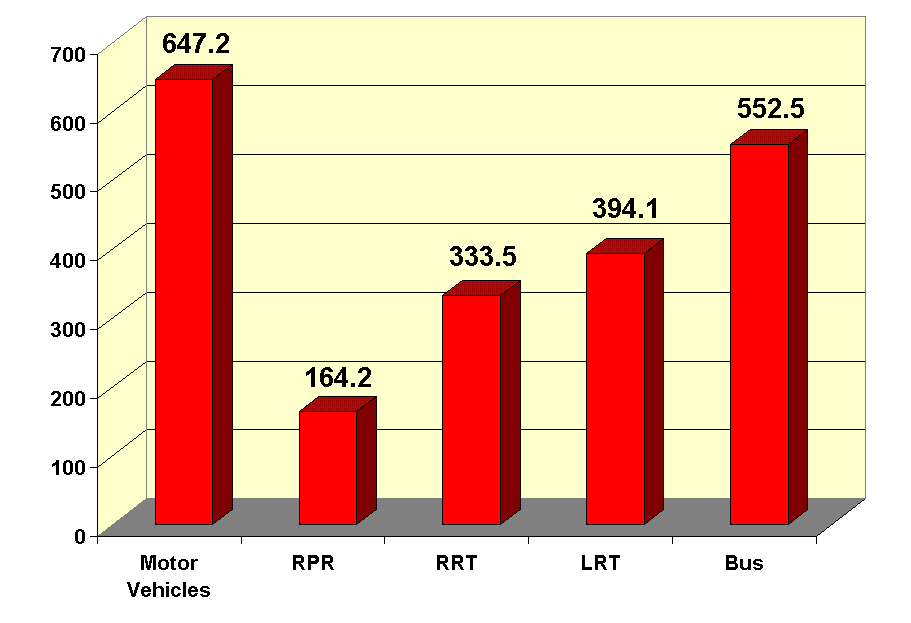
Averaging the three-year injury + fatality rates, our analysis calculates the average rates presented in the graph below: (Averaged for 2002-2004)
From these calculations, the following rather dramatic conclusions can be summarized:
Hopefully, the foregoing analysis will provide more much-needed factual information for the debate over urban transport safety raging within America's ongoing, relentless "Transit War", thus providing advocates of public transport and Smart Growth additional strong, fact-based resources to bring before planners, decisionmakers, and the general public. Light Rail Now! website | ||||||||||||||||||||||||||
|
|
|||||||||||||||||||||||||||
 • Regional passenger rail ("commuter rail") has by far the best safety record.
This public transit mode's combined fatality + injury rate is nearly four times lower (3.9 times lower) than that of highway motor vehicles;
or, expressed another way, it's just over one-fourth (25.3%) that of highway motor vehicles.
The high number of passenger-miles carried on typically longer-distance trips – with much of the trip length outside the heavier-traffic and more dangerous central cities – may account for this performance.
• Regional passenger rail ("commuter rail") has by far the best safety record.
This public transit mode's combined fatality + injury rate is nearly four times lower (3.9 times lower) than that of highway motor vehicles;
or, expressed another way, it's just over one-fourth (25.3%) that of highway motor vehicles.
The high number of passenger-miles carried on typically longer-distance trips – with much of the trip length outside the heavier-traffic and more dangerous central cities – may account for this performance.
 • Rail rapid transit has an excellent safety record for a mostly urban transit mode.
This mode's combined fatality + injury rate is nearly half (1.9 times lower, or 51.5%) that of highway motor vehicles.
• Rail rapid transit has an excellent safety record for a mostly urban transit mode.
This mode's combined fatality + injury rate is nearly half (1.9 times lower, or 51.5%) that of highway motor vehicles.
 • Light rail transit (LRT) follows rail rapid transit, with a combined fatality + injury rate about 1.6 times lower than that of highway motor vehicles.
in other words, LRT's fatality + injury rate is about 60.9% that of highway motor vehicles.
• Light rail transit (LRT) follows rail rapid transit, with a combined fatality + injury rate about 1.6 times lower than that of highway motor vehicles.
in other words, LRT's fatality + injury rate is about 60.9% that of highway motor vehicles.
 • Public transit buses have the highest fatality + injury rate, but nevertheless are safer than private motor vehicles with a rate 1.2 times lower (85.4% of the highway rate).