Light Rail Now (LRN) can be contacted at: Light Rail Now! |
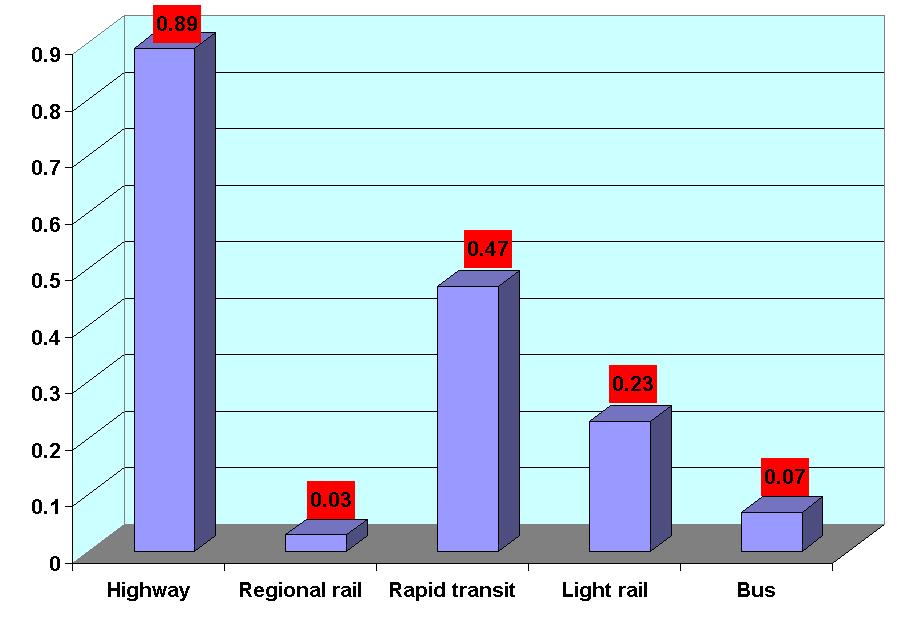
Comparing general fatalities among private motor vehicle and public transport is difficult because the standards for reporting and tabulating such accidents are significantly different (transit standards are far more rigorous). However, the standards are somewhat more similar for a comparison of fatalities among motor vehicle occupants vs. transit passengers – i.e., the individuals actually using these different transportation modes. In the table below, fatality rate statistics have been calculated for transit passengers vs. motor vehicle occupants. Motor vehicle fatality and passenger-mile data are from the US Bureau of Transportation Statistics, online, May 2003. They are based on the average of 1990-2000 (passenger-mile data for 2001 were not currently available). Transit data are taken from the American Public Transportation Association (APTA) and the National Transit Database (NTDB) of the Federal Transit Administration (FTA), online, May 2003. Data for 1999-2001 were averaged (since all relevant data items were available for that period). These data exclude suicides. Fatality rates per 100 million passenger-miles
These data are also illustrated in the graph below:
These data indicate that urban public transit modes are a significantly safer mode of travel than private motor vehicles for the people who are using them. Updated 2003/06/10 | ||||||||||
|
|
|||||||||||