Light Rail Now/Light Rail Progress can be contacted at: Light Rail Now! |
One of the hottest spots in the ongoing battle between automobile-favoring Road Warriors and transit proponents is currently centered in Orange County, California, just south of Los Angeles. As our story Orange County, Ca: Light Rail Vote Looms June 3rd (2003) relates, the Orange County Transportation Authority (OCTA) is proposing a brand-new light rail transit (LRT) starter project. OCTA's CenterLine Phase i project is an 11.4-mile LRT system which would run from the City of Santa Ana on the north, through Costa Mesa, to the City of irvine on the south. However, mobilizing against this plan is a motley assortment of opponents, generally cohering around a far-right, pro-highway, anti-transit ideology and mainly organized in and around a group called FAiR (Fund Alternatives instead of Rail). These naysayers have relied on a barrage of misinformation and deception, anti-transit Old Wives' Tales, and recycled myth-making from Wendell Cox and other familiar national transit opponents to try to sway the Orange County public to oppose the CenterLine project. FAiR's crusade has amounted to one of the most aggressive anti-rail campaigns in the nation, drawing on arguments aimed not just against the CenterLine project, but against mass transit and LRT generally – arguments which will probably emerge to be recycled in similar struggles in other cities. (One ultra-right, anti-transit radio talk show "jingo-jockey" in San Antonio has already raised some of these same issues in an effort to pillory LRT plans and operations in Texas.) The impact of LRT on home values is an issue which rail opponents exploit in two contradictory ways, depending on the intended audience. in some cases, LRT is portrayed as a purported steamroller of gentrification, threatening to make home values (and therefore property taxes) soar to unbearable levels. But FAiR opts to play up the opposite argument – that LRT will cause home values to drop by supposedly bringing adverse environmental impacts (along with the legendary "those people") into existing neighborhoods. "Home Values Down / Noise, Congestion and Crime UP" screams a headline on the FAiR website, with a warning that "Studies indicate a 5-10 percent negative impact on single-family home values. Light rail generates increases in noise, congestion and crime." Basically, this is a product of selective misquoting and deceptive interpretation of a recent study, How Will the Centerline Affect Property Values in Orange County? A Review of the Literature and Methodological Approaches for Future Consideration, from researchers at California State University at Fullerton. (For reference, we've included significant actual excerpts from this report, appended below.) Let's examine FAiR's contentions (i.e., myths), as expressed in both postings on the FAiR website and public comments by a FAiR representative. Myth: Single Family Home values could drop 5-10 percent if CenterLine were built. Reality: First, there are no single-family homes along the revised CenterLine route in irvine (where the project is up for a vote), so why is FAiR complaining? Second, the CSU-F survey results actually varied widely; other home values near LRT were found to be 10 percent higher than those not near LRT. Myth: The report also says that light rail results in "increases in noise, congestion and CRiME near stations," and that light rail can "stimulate urban sprawl." Reality: This is not accurate. The report actually states, "A positive capitalization is expected for sites 'near' (within 1/2 mile walking distance) a station, but there are possible negative effects for properties adjacent to the line itself and properties 'too close' (i.e. less than 300 meters) to a station that could suffer the negative nuisance effects of noise, congestion, and increased crime." [page 5] The only attempt in the CSU-F study to address the effect of crime states:
The word "sprawl" does not appear in the report, and the 12-mile CenterLine in the center of Orange County could hardly contribute to southern California's urban sprawl. Myth: Not surprisingly, the report also shows that California's "car culture" is not supportive of systems like CenterLine. Reality: Again, this is a serious misquote of the report, which actually states:
Clearly, FAiR has simply fabricated its own interpretation. The CSU-F report appears to say nothing about the effects of a "car culture" in California, neither in terms of public attitudes toward LRT nor in terms of LRT's impact on property values. Myth: Noise, congestion and crime could drive suburban dwellings further from jobs. Reality: There is nothing in the report which states or implies this. instead, the report cites both positive and negative effects of LRT services – including significant increases in property values in a number of cities:
At most, the report cites ambivalence by homeowners, but positive attitudes by apartment and condominium dwellers:
FAiR's claim that adverse LRT impacts "could drive suburban dwellings further from jobs" is an highly exaggerated interpretation of a carefully snipped segment of an observation from the CSU-F report; the complete quotation is as follows:
Thus, the actual quotation (a) says nothing about adverse rail impacts having a "decentralizing" effect, and (b) indicates a counter-balancing rail transit effect of encouraging an anti-sprawl "clustering" of downtown employment, at least in "older cities". in sum, the conclusion of the CSU-F as a whole, regarding the impact of rail transit on residential (and commercial) property values generally, would appear to be the diametrically exact opposite of what the FAiR fear-mongerers are claiming:
HOW WILL THE CENTERLINE AFFECT PROPERTY VALUES iN ORANGE COUNTY? A REViEW OF THE LITERATURE AND METHODOLOGiCAL APPROACHES FOR FUTURE CONSIDERATION Prepared by Lee Cockerill, M.A. and Denise Stanley, Ph.D. Institute of Economic and Environmental Studies California State University-Fullerton October 28, 2002 ... HOW WILL THE CENTERLINE AFFECT PROPERTY VALUES iN ORANGE COUNTY? EXECUTiVE SUMMARY The economic impact of public transit is an important concern for policymakers and the general public. One of the most important impacts is how a new transit system changes travel and residential and business location decisions, and, subsequently property values of nearby parcels. This report surveys the theoretical and empirical literature in this area to provide guidance to planners of the upcoming CenterLine project in Orange County, California. Economic theory suggests that the arrival of public transit can change the amenities associated with a given set of parcels. Namely, residents who use the transit system may enjoy reduced time traveling to employment, retail, and cultural opportunities while businesses near a transit station can face lower costs and agglomeration benefits. Thus it is often assumed that properties located near a station enjoy a premium over those farther from public transit. Some property owners may suffer a penalty from the nuisance effects of a rail system, but the net impact on the relevant residential property market should be positive. A small set of office, retail and industrial properties should enjoy equivocal positive premiums. The report then provides an overview of the common research techniques to empirically test the theoretical link between transit and land values. Of the three common methods-case comparisons, the matched pairs method, and multiple regression (hedonic) models-the later is preferred since it incorporates how non-transit attributes of a property also affect observed prices. The true premium or penalty associated just with the arrival of rail transit can be isolated, although this methodology requires intensive data collection and price observations well-after the construction of a transit system. The actual literature on how transit affects residential and commercial property values relies most heavily on hedonic price regressions, with varying results across cities and transit system type. Light-rail transit has enhanced residential property values some 2-18% in Portland, Sacramento, San Diego, and Santa Clara, with larger changes in cities with commuter rail systems. But not all residences benefit equally. Properties located too near a station may suffer nuisance effects, and it appears that in California the largest premiums accrue to owners of multifamily residential properties. Of the few commercial property markets studied, it appears that there are premiums of 4-30% for office, retail and industrial buildings located near rail transit in Santa Clara, Dallas, Washington, DC, Atlanta and San Fransisco. The report concludes that a comparable study of the CenterLine would best be undertaken after system construction is finished. Answers to several questions concerning system ridership uses and the mix of current properties near the proposed lines can provide some initial indications of the possible property value changes due to transit. Additionally, it appears that the CenterLine in its current alignment will be focused on three distinct "hubs" each of which could experience real estate market changes differently.
B. Previous residential property studies These general lessons from the theoretical overview are relevant in considering the actual benefits transit has empirically conferred on residential values (single-family home sales prices and apartment rents) and commercial values (office and industrial buildings rents and sales prices). A summary of the case studies below is incorporated in the tables of Appendix B. We separate residential and commercial properties since these markets could be driven by a different underlying dynamic between transit and values. For instance, transit changes may be capitalized into residential values since commute time savings accrue to one house over another, whereas owners and leasees of commercial properties are more concerned about how the reduced commute time could lessen the need for employee wage increases and increase the employee pool. Additionally, transit may have a decentralization effect as rail can stimulate suburban residential development away from the "Central Business District" while it could have a clustering effect in downtown employment in older cities. A city-by-city summary of the literature on the residential property value studies is presented in Appendix C, with those cities operating light rail systems considered first. in most cases comparability across the cities and the studies is nearly impossible. We highlight the "mitigating characteristics" of the transit-property value link by drawing attention to the rail type, study timing, measure of distance, and city-specific issues. Additionally, each study represents a different real estate market location and period. The results of each study are not presented in percentage terms for comparability; many studies report absolute dollar changes per distance measure which represents a very different result depending on whether the city generally is a high-priced or low-priced real estate market. However, in an attempt at comparability, PriceWaterhouse Coopers (2001) reviewed many of these studies and conclude that residential properties near a station see a positive premium of 0-5% following the arrival of a transit system. The premium is highest for those properties located between ¼-1 mile from a station. However, for residential properties along segments between stations there is a potential negative valuation of 5-10%. Thus clearly some property owners will enjoy a positive valuation externality due to a public transit project while others will not.
Nevertheless, the literature points to a general trend of a netpositive capitalization of some residential property values following the arrival of a transit system. Studies in Boston, Philadelphia, Portland, San Francisco, Arlington/ Washington D.C., Atlanta and San Diego found that residential properties with close proximity to rail stations had higher property values than those farther away. But higher residential property values are not apparent in San Jose, Sacramento, and Miami. These rail systems probably weren't as high quality as the others or they enjoyed very low ridership. Higher system ridership tends to increase positive property premiums throughout the transit area.
C. Commercial property studies There has been far less analysis of the synergy between public transit and nearby commercial (retail, office and industrial) values. Theoretically the presence of a transit station should enhance a nearby commercial property by providing benefits to both employees and owners. Thus in some aspects a public rail transit system may have a larger impact on commercial values than residential, particularly if a high-quality rail transit system is in place. in several studies commercial property received the largest land value premiums and discounts (Cevero and Duncan, 2002). But commercial property data is more obtuse than residential home prices. Rental data (asking rents) could be linked to occupancy rates and hide many components of an office contract beyond comparable properties near or far from transit. The building sales price and land value is more appropriate (Cevero, 1994), yet few studies have incorporated this data. An summary of the relevant studies of how rail transit has impacted commercial property values in seven cities in included in Appendix C. Most studies of the link between public rail transit and commercial properties have compared properties within walking distance to a station (< 1000 ft.) and those farther away. The areas between stations along a line are generally not applicable. Price Waterhouse, Coopers (2001), in a lengthy review of commercial studies, suggest that the nearer properties generally command a premium of $2-4/ sq. ft. over those sites away from transit. But the results have been very different across cities and transit systems and study timing (anticipation of transit or post-transit). Studies of Washington, D.C. (Damm, et.al., 1980) and Atlanta (Cevero, 1994) demonstrate properties near the rail station rise faster than those farther away but no-long-term effects are observed. Retail and office properties in Dallas and Santa Clara have enjoyed 4-30% premiums for being located near rail transit stations (Weinberger, 2000; Weinstein and Clower, 1999). Commerical property values were shown to rise in anticipation of rail transit in Los Angeles (Fejarang, 1994) and San Fransisco (Dyett, 1979). Yet studies suggest the premiums in San Fransisco have not lasted over time or been limited to a very short distance from stations (Cambridge Systematics, 1998). Capitalization benefits have been limited to only a subset of hubs in San Diego (Ryan, 1997; Cevero and Duncan, 2002).
D. Overall findings in the literature The published studies of the capitalization effects of public rail systems supports some of the theoretical ideas mentioned above, but draws out some nuisanced trends. Some of these issues may be particularly relevant for future light-rail programs in California, as the study results are affected by city and cultural differences as much as economic factors. Some of the important trends in literature as regards to the rail system scale, type of system, timing of analysis and study methodologies are discussed next. First, across the fourteen city systems analyzed, inherent cultural differences may be as important as system scale and type in mediating how a land market reacts to public transit. All of the systems incorporate at least 15 miles of track or 15 stations, with at least 2 million passengers per year reported at the time of the study. Among all types of rail systems, the reality of a shared freight right-of-way has caused nuisance effects for some residences both near stations and lines, thus limiting property value increases post-construction. And the presence of competing freeway access near a station tends to diminish the benefits of rail transit per se. As expected, the capitalization premiums appear to be higher with the establishment of heavy and commuter rail systems. Turning to the light- rail systems, Portland and Dallas have smallest scale operations as regards the distance and stations included. But the land market changes in Portland have been more extensive than those in cities with larger systems (such as Miami). A strong Smart Growth planning initiative in Portland and attempts to install a culture of reducing congestion have enhanced ridership and the premium residential owners place on being located near public transit. Authors of studies in both Miami and Dallas, where the effects on residential properties were actually negative, suggest that the "car culture" of these cities has limited public enthusiasm for light rail and thus dampened property value impacts. The studies of various systems in California indicate smaller, and highly varied, land market effects of public transit. Earlier studies focused on only average changes in residential housing prices, but later studies have picked up differences within the residential market. it now appears that the owners of single-family housing in California are not particularly enthusiastic about the presence of public transit, while residents of condominiums and apartments demand more of these services to reduce travel time. This trend could differ from other parts of the country where property capitalization premiums have tended to be larger in higher-income neighborhoods. Apparently wealthier residents in older cities place a high valuation on the travel cost savings public rail transit provides whereas California residents may be incorporating other concerns in their property valuations.
Second, while there are fewer studies of transit's effects on commercial property values, the general trend has been positive for the well-established systems. in cities where both the residential and commercial markets have been analyzed (such as Washington, DC and Atlanta), higher premiums occur in the latter. Yet the California studies of both light and heavy seem to represent some exceptions. in San Diego the commercial benefits appear to be concentrated only in the central business district rather than any suburban office zones. And in San Fransisco and Los Angeles few capitalization have appeared for commercial properties located nearer transit stations. Most analyses of these cases have suggested that varied city economic development policies could be contributing to these real estate trends. For instance, Atlanta and Washington have undertaken strong transit-oriented development programs while the Los Angeles Red line rail was placed within a less successful redevelopment zone.
Finally, some lessons about methodology and analysis timing appear from the previous studies. The literature is equally divided into whether "transit access" should be just a positive variable in a statistical analysis (as a "dummy") or whether the actual linear distance from the station affects economic trends and property values in different ways. Those studies which have statistically incorporated distance (as a "continuous" variable) still have not adequately explored if this geographic trend is strictly increasing so that nearer properties command higher premiums or whether some other mathematical relationship (i.e. reciprocal or cubic forms) are more appropriate.
The hedonic price regression technique is favored by most authors for its ability to control many factors reflected in property prices apart from transit access. The method, of course, assumes that property prices have adjusted to include the impact of transit location on the economy. Thus a consensus is emerging that such studies using hedonic methods are best employed well-after a public transit system has been constructed. The "anticipation" studies measuring property values before a system is operating show benefits to sites nearer transit stations, but this empirical result is difficult to explain. Studies completed right after a system construction tend to show small premiums for transit access, but after residents have adjusted their travel habits over time, property values increase further. Thus the group of studies taking place at least five years after a system opening reflect higher, and perhaps more accurate, representations of how transit affects the prices of homes and commercial spaces.
APPENDIX C: DETAILS OF CITY PROPERTY VALUE STUDIES RESIDENTIAL PROPERTY IMPACTS 1) Light Rail System studies A. San Diego San Diego's light-rail system (Trolley) was constructed in [1981] to include 35 miles and 8 real estate market areas. It was later expanded to 34 stations across 40 miles serving some 16 million passengers. Parts of the line are located in distressed corridor areas that have been freight rail right-of-ways. Additionally, the Coaster commuter train serves the downtown area and north county zones. An early pre-study of the system (Landis, et.al., 1994) used data on 134 single family home sales in 1990 with the hedonic price regression method to control for other factors underlying home prices. The study found residences near a Trolley station in city of San Diego received capitalization benefits; for every meter closer to a station, house prices rose $2.72. The effect did not hold outside of the city limits, however. More recently Cevero and Duncan (2001-2) used hedonic price models to analyze two transit systems in San Diego: 4 lines of the Trolley and the Commuter Coaster Rail. The 2000 sales prices of 25,000 parcels across different parts of San Diego were considered. The study simultaneously accesses transit access (measured by dummy variables at 1/4-1/2 mile distance from the station) and freeway access. These authors find that multi-family housing (apartments sales prices) had premiums of 4-18% along the Trolley light-rail line, while condominum sales prices were 2-6% higher. Apparently residents in these types of housing value the savings in commute time that public transit offers. However, the prices of single-family homes sold in this year were 0-4% lower, suggesting a negative premium associated with the light-rail system. interestingly, trends associated with the Coaster commuter rail line were different; apartment sales prices were lower for those buildings alongside the Coaster line, while condominium sales prices were significantly higher (46%). Single-family home prices were also higher along the Coaster line.
B. Portland This city's light-rail system (MAX) was begun in 1986 to cover 15 miles with 32 stations. Part of the MAX line coexists with a freight right-of-way. The city is well-known for its simultaneous Smart Growth and revitalization programs which have affected transit and residence patterns. Not surprisingly, two of the three Portland studies have demonstrated a positive effect to property owners residing near the MAX system. An early study of the system Al-Mosaind, et.al. (1988) examined 1988 property values sales data of those residences houses very close to the MAX stations (a dummy if the house was within 1/4 mile or 500 meters) against set of more distant properties. They find that these residences near the stations were priced 10.6% higher than those farther away, after controlling for other factors. This premium translated into a $4000 premium in the 1988 sales price. A later repeat study by Chen (1998) attempted to separate out the positive access effects from the negative nuisances effects of transit for those residences adjacent to the public transit system. Data in this study on the 1994-96 sales prices of houses could better reflect the permanent land market changes due to transit. Distance from the station was measured as a continuous variable, and again houses nearer the stations were priced higher. Houses farther away from the rail station had decreasing prices, but at a decreasing rate. However, a parallel study of the Portland system in 1997 (Lewis-Workman and Brod) found that houses alongside both stations and the transit line suffered lower property values, all else equal. The nuisance effects of noise along the freight right-of-way of the rail line were blamed for the negative results.
C. Santa Clara-San Jose The Santa Clara/San Jose light-rail train system has been the main focus of analysis in this area. The Santa Clara line opened in 1987-91 as a 20 mile system with very high-quality 24-hour service. By 1991 the system ran 39 miles with 33 stations and an estimated 2.4 million riders (Landis, et.al., 1994). The system opened in 1988 and concentrates in the city's downtown area. The only study conducted of this system (Landis, et.al., 1994) found few capitalization benefits for homeowners near the transit stations. The study used the common hedonic price regression method to observe single-family home sales price among houses with access to public transit and those without access. Controlling for other factors, it appears that average prices of single-family homes in San Jose declined with increasing proximity to a station; house prices fell for $1.97 for each meter the house was nearer to a station. The authors suggest the system's newness, limited services, and low ridership as contributing factors. Additionally, many of the transit stations are located in neighborhoods dominated by industrial uses. D. Sacramento Sacramento's light-rail system was also constructed in the mid-eighties (1986) to cover a moderate length of 36 miles by 28 stations. By 1991 is had achieved an estimated ridership of 5.7 million passengers (Landis, et.al., 1994). it covers both residential and downtown areas with some common rights-of-way on the transit lines. The system has not been widely-studied and appears to have had few effects on residential property values. Landis et.al. (1994) used hedonic price regressions to determine that single-family houses enjoyed no significant capitalization for being near station. Neither positive nor negative price premiums were observed in houses nearer the transit stations as compared to those farther away. The extensive freeway commuting pattern of the city's residents and the small ridership of the system could be important factors in this result. E. Los Angeles The city and county of Los Angeles actually operate several varied forms of public rail transit. The Metro redline is a form of heavy rail, the Metrolink represents the region's extended commuter system, while the Metro Green and Blue lines (connecting the Metrolink Union Station terminus to other parts of Los Angeles) are light-rail transit lines. These 2 lines together include 36 stations across 42 miles with an estimated daily ridership of 95,000 people in 2000 (Cevero and Duncan, 2002). They were constructed as part of the city's "Transit Oriented Development" revitalization efforts in the mid-nineties. The study by Cevero and Duncan (2002) represents the only attempt to assess the capitalization effects of this recent transit system. The paper uses hedonic price regressions on 60,000 parcel sales in 2000 to find varied impacts across residential property type and locations. The Blue and Green lines brought a small 1-3.5% premium to multifamily housing (apartments) and single-family homes sold that were nearer the stations than those which were not. However the prices of condominiums which were nearer the Blue line were 6% less than those farther away, controlling for other factors. The small ridership on these lines and patterns of station location could be contributing to the limited results observed thus far.
F. Dallas This light-rail system (DART) has 15 stations that opened in 1996. One study of residential values in Dallas (Weinstein and Clower, 1999) examined the changes in taxable values between 1994 and 1998 for houses near DART (within 1/4 mile of the stations) with matched pair properties of those farther away. This study could include both appreciation effects due to anticipation of a system (in the 1994 data) and initial capitalization effects following the opening of public transit. The authors suggest the value-added associated to neighborhoods with station proximity is around 25% for all types of properties. However, their study suggests residential properties could be negatively-affected compared to retail space owners. During the 4-year period residential properties in neighborhoods near DART stations rose 11% while comparables actually rose 16%. However, this study does not utilize hedonic price regressions technique, so part of this value-added may be associated with other factors such as residence and location quality. 2) Rapid and commuter rail systems A. San Fransisco This extensive heavy rail system is one of the older and more-studied systems in the United States. The "BART" was constructed in 1975 and expanded to cover 142 miles across 34 stations. By 1991 it achieved a 75 million passenger ridership, the largest in California (Landis, et.al., 1994). BART also enjoys a large market area of nearly 2.1 million people residing within 3 miles of the lines. A complementary system, the CalTrain commuter rail line, runs 94 miles across 26 stations in the South Bay and San Jose area. Numerous studies conducted in the late seventies and early eighties showed little significant impact of the system. But as a time lag passed and the commuting habits of Bay Area residents changed, the property value capitalization effects have become evident. Nearly every study undertaken in the nineties (twenty years after the system opening) shows positive capitalization for residential properties with access to BART. in 1994 Landis, et.al. examined home values in the Alameda, Contra, and San Mateo counties, some of which were alongside either BART or the CalTrain system. Based on 1990 sales prices, he estimated that home prices significantly increased $2.29 in Alameda for every meter a house was closer to the station, controlling for other factors including freeway access. The hedonic regressions demonstrated a $1.96/ meter premium for Contra County. The premium of approximately $68,6000 for the nearby homes represents nearly 25% of the 1990 sales values. incorporating a dummy variable for city municipal service differentials reduces the premium associated with being near BART by about 40%. No premium was found in the sales prices of homes near the CalTrain stations in San Mateo county. The study also incorporated a dummy variable for houses immediately proximate to the public transit system to consider the nuisance effects of the system. The authors find that houses too close (within 300 meters) of the CalTrain line sold at a discount of nearly 15% due to the disamenities for noise along the right of way. A follow-up case study in 1997 (Lewis, et.al.) echoed these results in demonstrating that average home prices declined by about $1578 for every 100 feet further from the Pleasant Hill station. Cevero's 1996 study turned to the apartment rental market in the San Fransisco area. He used a matched-pair comparisons of apartment units near and far from BART stations and found that those units within walking distance (1/4 mile) of a suburban BART station commanded a 15% monthly rent premium. for units within walking distance of a suburban BART station. The results were not significant for Alameda County, however. Finally, Cambridge Systematics' 1998 study focused on the central city and suburban areas. The results suggest single-family residences near stations (1 mile down to 1/4 mile distance) enjoyed a premium ranging from $5,700-$49,000 in the central business district while those in suburban areas saw a premium of $5,000-9,000. The effects on apartment rent differentials were less apparent; only those units very near BART stations (less than 1300 ft.) rented for about $50/ month more on average over comparables. Updated 2003/05/30 |
|
|
|
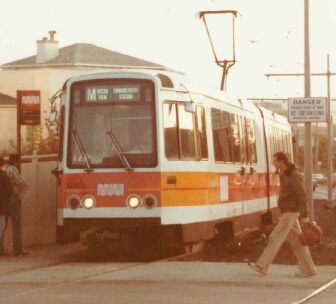
 Passengers board a San Francisco Muni M-Line
LRT train running on private right-of-way through a
residential neighborhood.
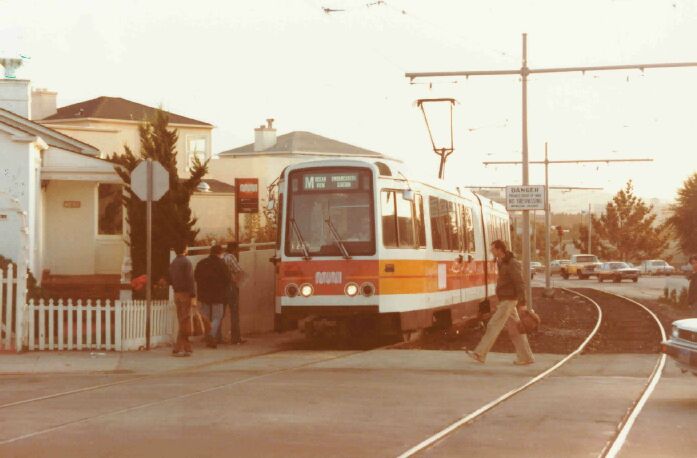
Passengers board a San Francisco Muni M-Line
LRT train running on private right-of-way through a
residential neighborhood.